The following is FTMO academy Answers Part 2 of their training program.
Please note that the information below is for informational purposes only. Try your hand at the course before continuing.
There is a lot of useful information that FTMO has to offer in the course.
Use Ctrl + F to find the answer faster.

I. Technical Analysis
01. Japanese Candlesticks
1. What parts are Japanese candlesticks made of?

2. What is the name of candlesticks that close above the opening price?

3. What do the wicks of a candlestick represent?

4. Where can we find the Japanese candlesticks pattern?

5. Short day candlesticks are usually used as an entry or an exit signal. Yes or no?

6. What type of candlestick has no upper, lower or both wicks?

7. What type of candlestick pattern is Doji?

8. What type of candlestick pattern is the Dragonfly candlestick Doji?

9. What timeframe of candlestick charts is best for executing a position?

10. What type of analysis do candlesticks belong to?

02. Types of Trading Chart
1. Is it possible that we have two traders with identical behaviour?

2. What is the most popular method for a price action strategy?

3. Which type of trading chart is most used for trading?

4. Which type of a trading chart is based on candlesticks but has a different calculation method?

5. Which trading chart eliminates the time factor?

6. Which units represent trading movements in the Renko pattern?

7. What type of trading chart can you set up for a specific period of time, based on your own range or tick as you want?

8. What type of trading chart filters out noise and helps a trader to see the trend more clearly?

03. Market Environment – Ranges vs Trends
1. What do lower lows and lower highs represent?

2. What indicator is the most popular one for determining trends?

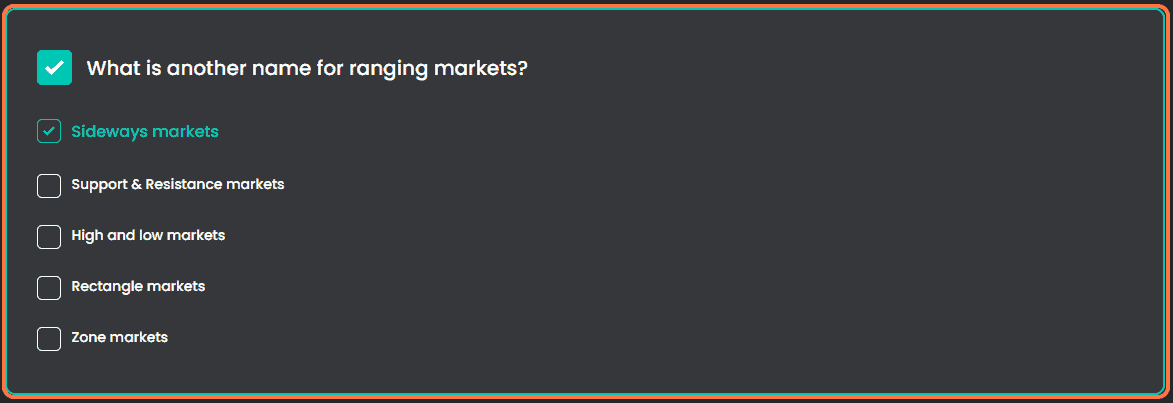
3. What is another name for ranging markets?
4. What strategy will be probably used in ranging markets?

5. The Bollinger bands is one of the most popular mean reversion indicators.

6. Is it better to follow trends or ranging markets?

7. If we are in a … and the last swing is … which leads to the lowest … being broken, we can possibly see some opportunities for long positions. (complete sentence)

8. The highest price level is acting as ….. in ranging markets. (complete sentence)

9. How can you recognize an uptrend?

04. Support and Resistance
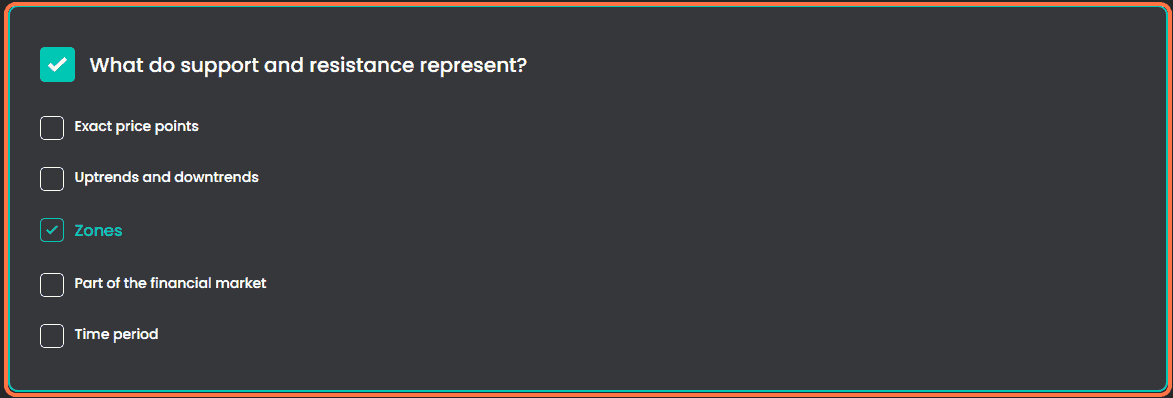
1. What do support and resistance represent?
2. What time frames have more significance for a swing trader?

3. Is it true that support and resistance zones are stronger or weaker depending on the amount of times they are touched by price movements?

4. What do breakout traders do?

5. What can be also used as significant support and resistance levels?

6. Is it correct, that diagonal support and resistance can be more subjective than horizontal as they can be drawn by connecting any two and more price swings?

7. What are trend lines?

8. The more touches the trendline has, the more … it becomes and it’s likely … (complete sentence)

05. Supply and Demand Trading
1. What two types of orders can traders place?

2. Who has the biggest impact on the markets?

3. Zones on higher time frames carry … value than on lower time frames. (complete sentence)

4. Are supply and demand dynamics also present in financial markets?

5. What happens with the price if many buyers are willing to buy for a higher price?

6. If aggressive buyers overcome the sellers, what happens?

7. For every buyer there has to be a seller and vice versa, is that correct?

8. What do you have to look at if you want to identify supply and demand zones ?

06. Chart Patterns Trading
1. What is the neckline?

2. When do inverse head and shoulders occur?

3. Inverted Cup&Handle is a … continuation pattern. (complete sentence)

4. The descending triangle is visible when the market is bouncing from support but cannot make lower … (complete sentence)

5. What pattern is this: a bearish reversal pattern characterised by the peak which is shortly followed by a second peak at the same or a very similar price point?

6. A double top pattern is usually created as a topping formation at the end of a trend, correct?

7. … is a continuation pattern that gives you an opportunity to enter the market in the middle of a trend. (complete sentence)

8. What kinds of flags exist?

07. Fibonacci Trading
1. How are standard numbers of Fibonacci sequence generated?

2. Fibonacci retracement can be used … (complete sentence)

3. What is the purpose of the Fibonacci extension?

4. Which numbers belong to the Fibonacci sequence?

5. What decimal number is called the “golden ratio”?

6. Is the 50% retracement a Fibonacci level?

7. Why do traders use Fibonacci numbers?

8. The Fibonacci sequence is a series of numbers where each number is the sum of the … preceding numbers. (complete sentence)

9. What is the main disadvantage of using the Fibonacci retracement/extension in the technical analysis?

10. The most popular Fibonacci retracement levels in trading are:

08. Technical Indicators
1. Is the Bollinger Band a type of a moving average?

2. Do you need to watch technical indicators while trading?

3. How many indicators do we have?

4. What is “RSI”?

5. What units does “RSI” measure?

6. What does the MACD (Moving Average Convergence Divergence) indicator measure?

7. What does the kijun-sen line represent in the Ichimoku cloud?

8. What is the significance of a price trend being above the Ichimoku cloud?

9. What information can Bollinger Band provide?

09. Divergence Trading
1. What are divergences not used for?

2. What is divergence trading?

3. We have two types of divergence trading. What are they called?

4. Regular divergences are useful for trend reversals, is that correct?

5. What is the main difference between bullish and bearish divergences?

6. In what type of conditions is it better to use divergences?

7. What is a bearish divergence in divergence trading?

10. How to spot breakouts & fakeouts
1. What do we use Volatility for?

2. When can volatility be avoided?

3. Can a breakout happen during high volatility?

4. What is a breakout in trading?

5. What is the main goal for a trader trading breakouts?

6. Why do fakeouts occur?

11. Multiple Timeframe Analysis
1. Do you need to pay much attention to monthly, quarterly and yearly charts when you trade intraweekly and intraday?

2. Is multiple timeframe analysis applicable to all types of financial markets and instruments?

3. Does the multiple timeframe analysis only apply to short-term trades?

4. Does using multiple timeframes increase the accuracy of trading sessions and your profits?

5. How does reviewing multiple timeframes affect the amount of time spent on analysis?

6. Is it better to use only a single timeframe in multiple timeframe analysis?

7. What is the optimal time frame combination you should use in multiple timeframe analysis?

8. Does a multiple timeframe analysis improve the profitability in trading?

9. One of the following characteristics for a multiple timeframe analysis isn’t correct, which one is it?

10. Does a multiple timeframe analysis apply only to stocks and not to other financial markets?

II. Statistical Analysis
Use Ctrl + F to find the answer faster.

01. Backtesting a trading strategy
1. What is backtesting?

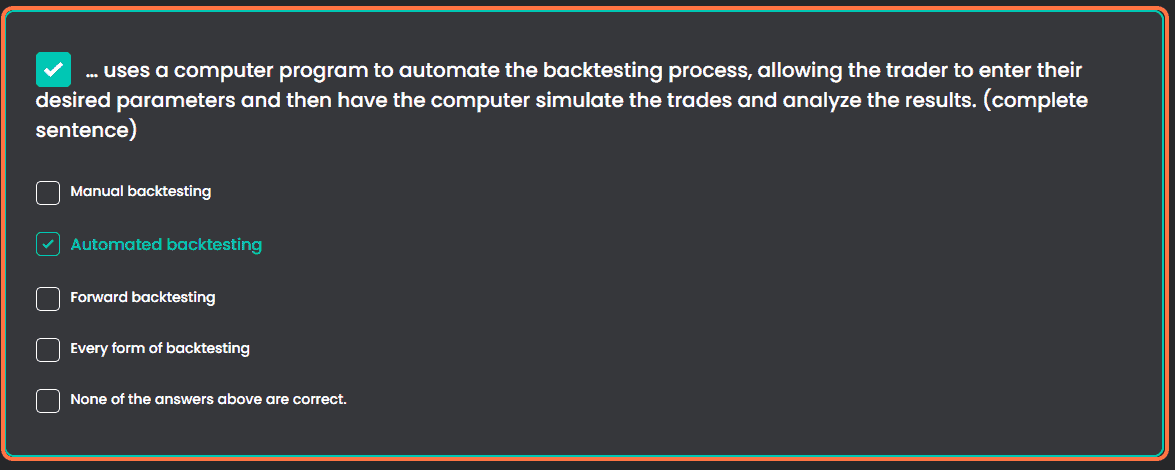
2. … uses a computer program to automate the backtesting process, allowing the trader to enter their desired parameters and then have the computer simulate the trades and analyze the results. (complete sentence)
3. Find the incorrect fact about manual backtesting.

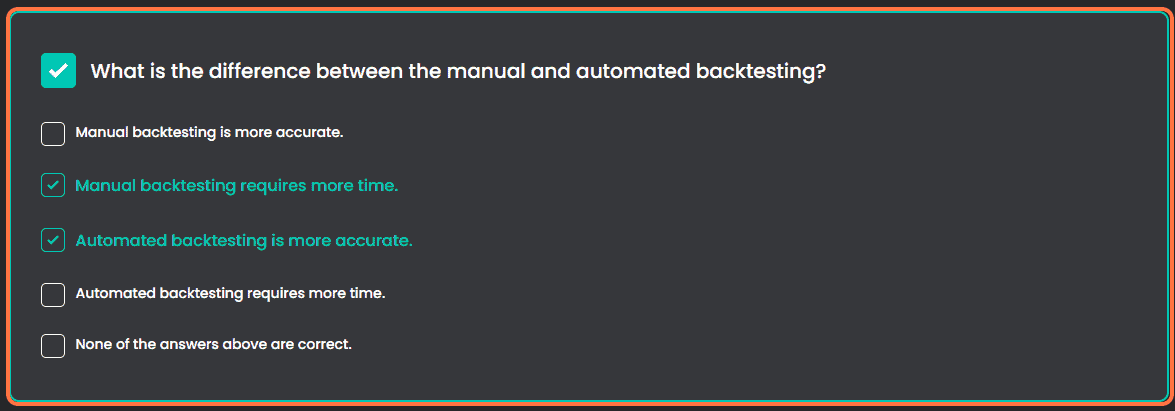
4. What is the difference between the manual and automated backtesting?
5. What kind of backtesting removes all emotions?

02. Statistical Application
1. What does the range measure?

2. What is a gap?

3. Why is the range analysis useful?

III. Fundamental Analysis
01. Fundamental Indicators
1. How many fundamental indicators do we have?

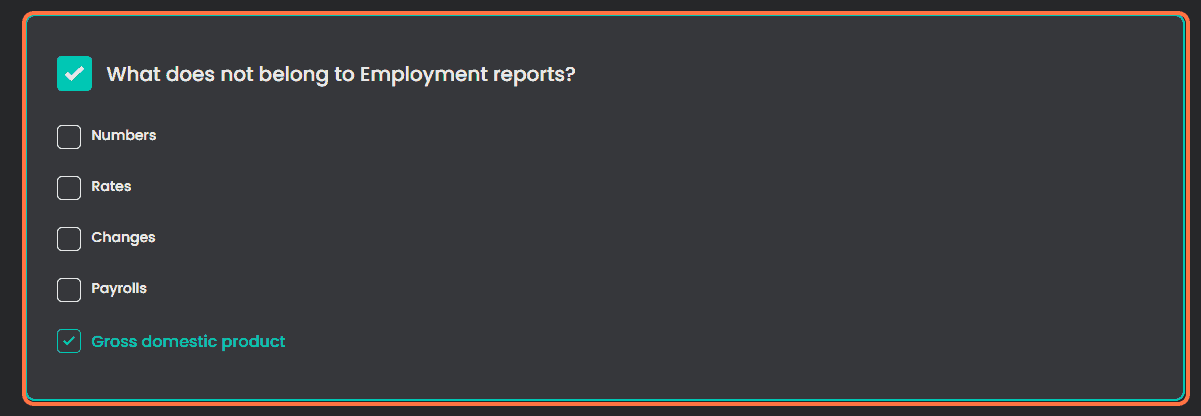
2. What does not belong to Employment reports?
3. What is the most anticipated financial report?

4. Can a change in gross domestic product have an impact on foreign currency?

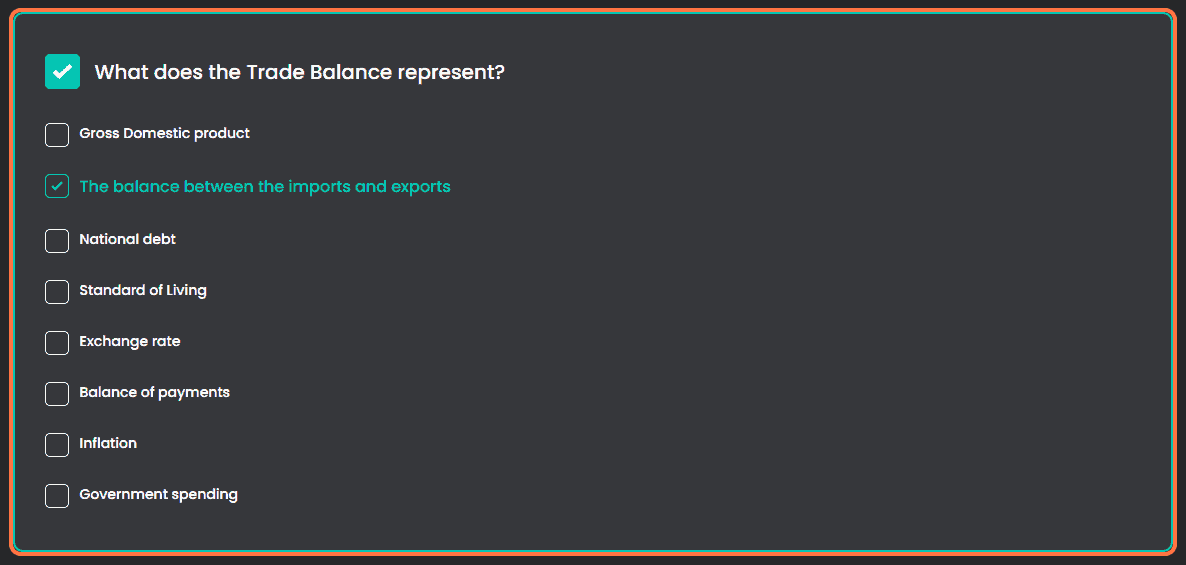
5. What does the Trade Balance represent?
6. A decrease in GDP indicates a … economy and therefore the possibility of falling prices in the currency.

7. Which of these facts about CPI – Consumer price index are incorrect?

8. What are the main advantages of the US NFP and many other macro-economic reports?

9. What is GDP – Gross Domestic product?

02. Economic Calendar
1. Which one of the following statements about the Economic calendar is correct?

2. How often should a day trader pay attention to the economic calendar?

3. Is the Economic Calendar an important part of fundamental analysis?

4. How many economic calendars do we have in general?

5. The more important the news, the … impact in terms of volatility is expected. (complete sentence)

6. Does FTMO offer an economic calendar on its website?

7. Which of the following economic indicators is an indicator of economic growth?

8. What does a government’s economic policy do?

9. Is it true that macroeconomic news announcements are often connected to higher volatility?

03. Risk-On vs Risk-Off
1. How do market participants feel about the economy when there’s a risk-on environment?

2. What is an example of a low-risky asset?

3. What is a typical behavior for a risk-off environment?

4. What are the typical risk-off assets?

5. What does “carry trade” mean?

6. What is tracking the performance of the US Market?

7. What does the US Dollar index track?

8. What type of investment is generally more volatile?

9. What is the U.S. Dollar Index?

10. Which statement below does not belong to the benefits of tracking the U.S. Dollar Index?

04. Market Correlations
1. Where are you more likely to spot market correlations?

2. Which one of these facts about Market correlations is incorrect?

3. When Indices go down it may signal that… (complete sentence)

4. Is Crude oil important for the Canadian economy and what kind of correlation is it?

5. Is it true that both Australian and Canadian economies are heavily independent on commodities?

6. If the Australian dollar is rising, we can see a … correlation with the global economy. (complete sentence)

7. Can correlations change over time?

8. Is it a good idea to solely rely on market correlations when making trading decisions?

9. Can correlations between markets be influenced by external factors such as geopolitical events or economic data releases?

10. Why are market correlations important in building a trading strategy?

IV. Sentiment Analysis
01. How to read COT
1. What does COT stand for?

2. The COT report shows … positions by all the subjects that have to report their positions at CFTC. (complete sentence)

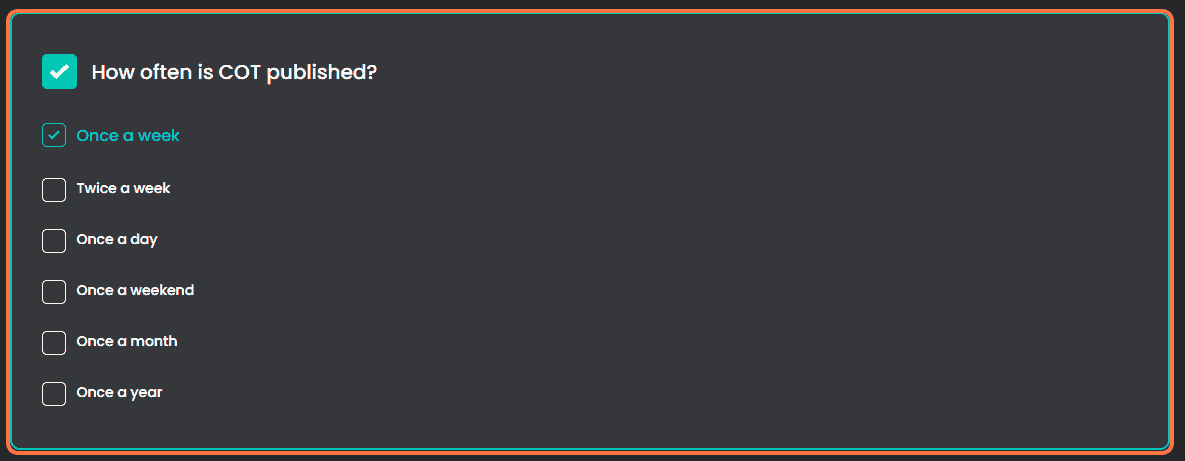
3. How often is COT published?
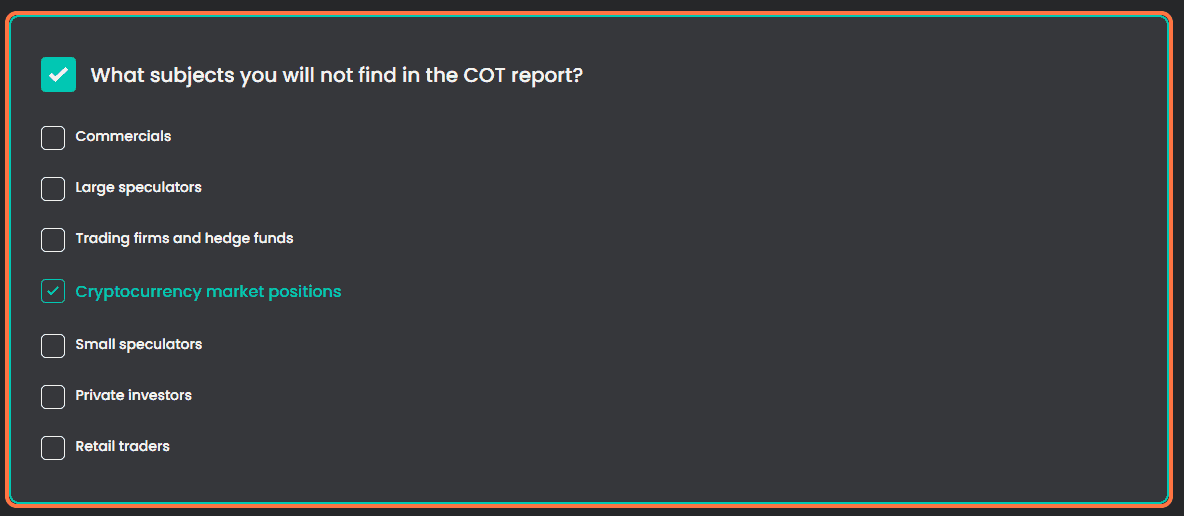
4. What subjects you will not find in the COT report?
5. What is the percentage of open positions the COT report shows at futures markets?

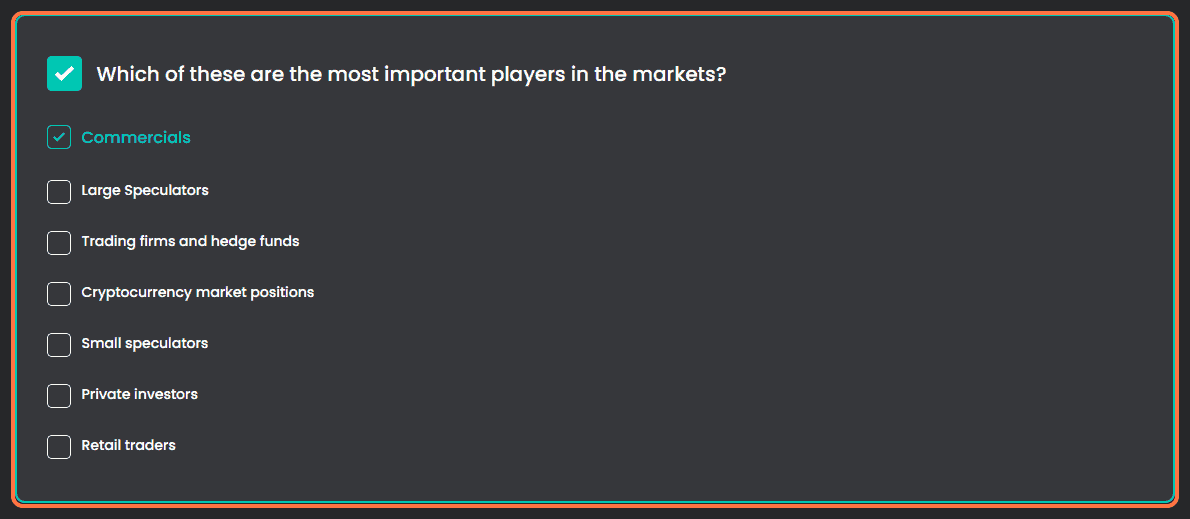
6. Which of these are the most important players in the markets?
7. Does COT serve as a confirmation tool or stand-alone strategy?

8. What is the COT report?

9. What does not belong to Employment reports?

That’s all of FTMO Academy Answers Part 2. Next here: Part 3.
Feel free to ask anything in comment below.

phần 04. Market Correlations bị nhầm sang phần khác, nhờ AD sửa lại nhé
Cảm ơn bạn. Chỉ giúp mình nhầm ở phần nào với được không? Mình tìm không rõ nhầm ở đâu…
Mình cập nhật rồi, cảm ơn bạn.
You are legend